
Bitcoin’s Power Law and the Slope–Intercept Framework
The Hidden Mathematical Structure Behind BTC’s Long-Term Growth

←Click for free info!
Most people think Bitcoin’s long-term price behavior is chaotic, unpredictable, or driven purely by market psychology.
In reality, Bitcoin follows one of the most elegant and measurable mathematical patterns known in science: a power law.
And surprisingly, this pattern connects directly to something every student learns in high school math:
👉 the slope–intercept formula
👉 y = mx + b
This article explains that connection — and why it matters for long-term Bitcoin analysis.
1. What “Slope–Intercept” Means in Mathematics
In basic algebra, the slope–intercept equation is:
y=mx+b
Where:
m = slope → how fast the line rises or falls
b = intercept → where the line crosses the y-axis
x = independent variable
y = dependent variable
It is the simplest and most universal description of a linear relationship.
2. How Slope–Intercept Shows Up in Bitcoin’s Growth
Bitcoin’s price does not grow linearly on a normal chart.
But when you transform the axes using logarithms, something incredible happens:
When you plot:
X-axis: days since the Genesis Block on a log₁₀ scale
Y-axis: Bitcoin’s price on a log₁₀ scale
…the price history forms an almost perfect straight line.
Mathematically:
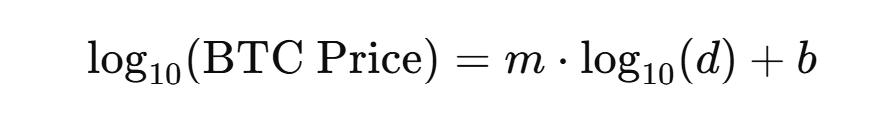
This is the slope–intercept form, just expressed in log terms.
It means Bitcoin follows a clear, measurable trend — linear in log-log space — even though the real price looks volatile.
3. How the Bitcoin Power Law Formula Connects Directly to
y = mx + b
The well-known Bitcoin Power Law model by physicist Giovanni Santostasi is often written as:
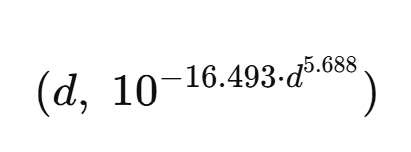
At first glance, this looks nothing like y = mx + b.
That’s because it’s written in exponential form, which is the natural format for power-law phenomena.
But when we apply a logarithm to the price term, everything simplifies:

Now compare this directly to:
y=mx+b
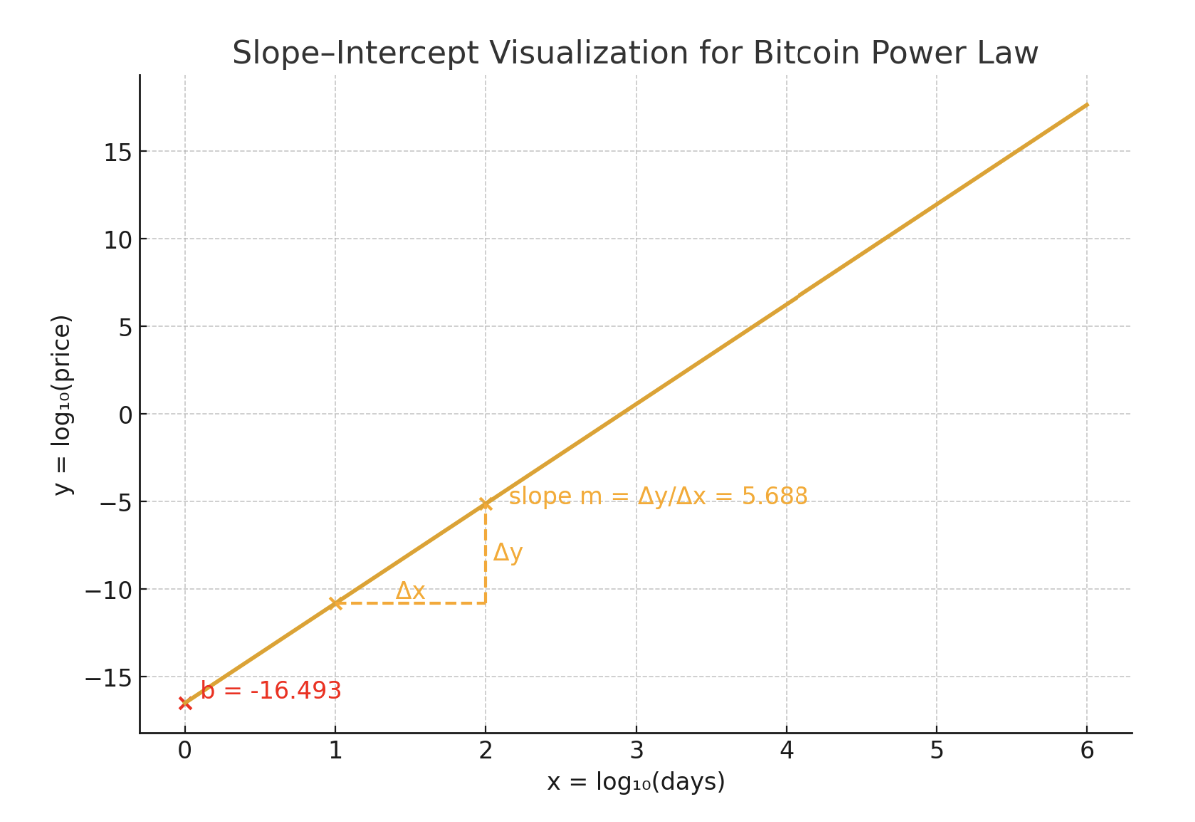
And we can identify:
Slope (m) = 5.688
Intercept (b) = –16.493
This means the Bitcoin Power Law is literally a straight line in log–log space.
Bitcoin’s long-term price trend follows the simplest linear equation possible — just expressed on logarithmic axes.
4. Why This Matters for Bitcoin Analysis
The implications are huge:
1. Bitcoin’s long-term growth is not random.
It reflects a mathematical order, not chaos.
2. The slope (m) represents Bitcoin’s long-term adoption strength.
A steeper slope means faster historical network growth.
3. The intercept (b) anchors the entire trajectory.
It represents the system’s “starting point” on day zero.
4. Volatility is noise — but the Power Law is the signal.
Crashes and manias oscillate around the same straight line.
The line hardly moves — only the price does.
5. This behavior is extremely rare in finance.
Power-law linearity in log-log charts usually appears only in:
physics
engineering
biological growth
complex networks
Bitcoin behaves more like a natural law than a traditional financial asset.
5. Why Bitcoin Consulting LLC Uses the Power Law Every Day
Understanding the slope–intercept structure behind Bitcoin’s Power Law allows analysts to:
model long-term fair value
build strategic Bitcoin reserves
distinguish noise from signal
plan multi-year corporate accumulation strategies
estimate cycle ranges with high statistical consistency
At Bitcoin Consulting LLC, we apply this framework when helping families, businesses, and investors understand Bitcoin’s macro behavior.
It is one of the most reliable, research-backed tools for interpreting Bitcoin’s long-term trajectory.
Conclusion
The connection between the simple equation y = mx + b and Bitcoin’s Power Law reveals a powerful truth:
👉 Bitcoin is not random — it follows a predictable mathematical structure.
👉 The power law is the hidden order beneath the volatility.
By recognizing this slope–intercept relationship, anyone can understand why Bitcoin keeps returning to the same long-term exponential path… and why its adoption curve continues to grow.